Trading Platform Analytics for Brokerages and Prop Firms - FirmForge
EUR/USD 1.08421 GBP/USD 1.27180 XAU/USD 2,318.10 BTC/USD 67,238.00 US30 38,940.00 USD/JPY 156.210 ETH/USD 3,481.20 NAS100 18,204.50 WTI/USD 78.320 EUR/USD 1.08421 GBP/USD 1.27180 XAU/USD 2,318.10 BTC/USD 67,238.00 US30 38,940.00 USD/JPY 156.210 ETH/USD 3,481.20 NAS100 18,204.50 WTI/USD 78.320

Analytics

The analytics every brokerage and prop firm needs.

Trader cohorts, revenue by rail, retention curves, challenge economics, payout rate, LTV, churn signals. Built into the admin, exportable to BigQuery or Snowflake. No stitching together payment reports with trade history manually.

The numbers that answer whether the firm is actually growing.

trade-yourbrand.com
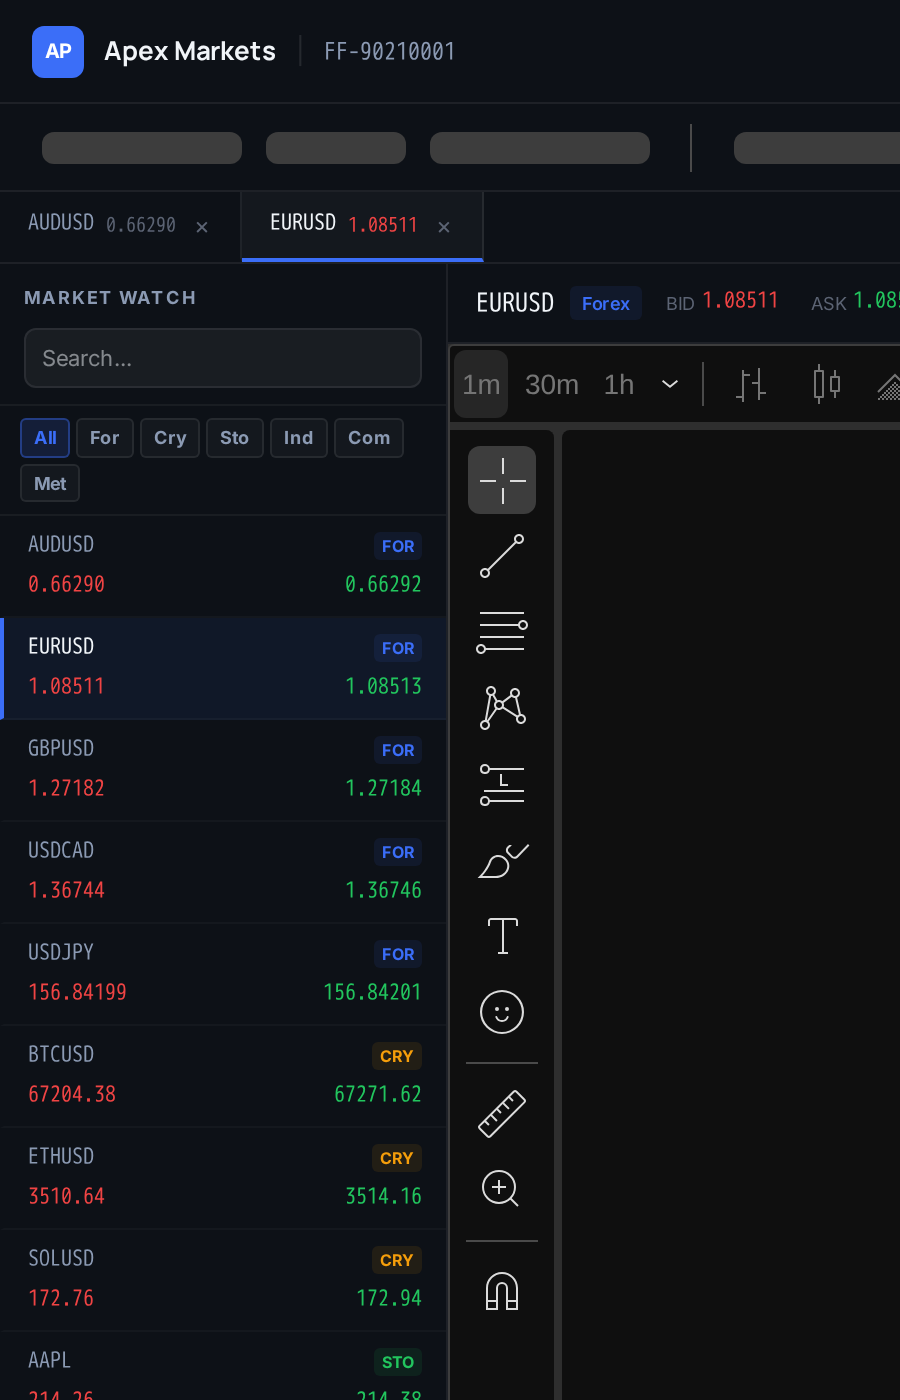
Real FirmForge trade room
Cohort Analysis Retention Curves Revenue by Rail Challenge Economics LTV and Churn Data Export

What ships

Analytics that answer the questions you actually ask

Who deposits again. What challenge sizes pass. Which rail drives most LTV. When do traders go quiet. Numbers the operator asks on Monday morning, in dashboards built for those questions, not generic BI.

my-yourbrand.com/portal/dashboard
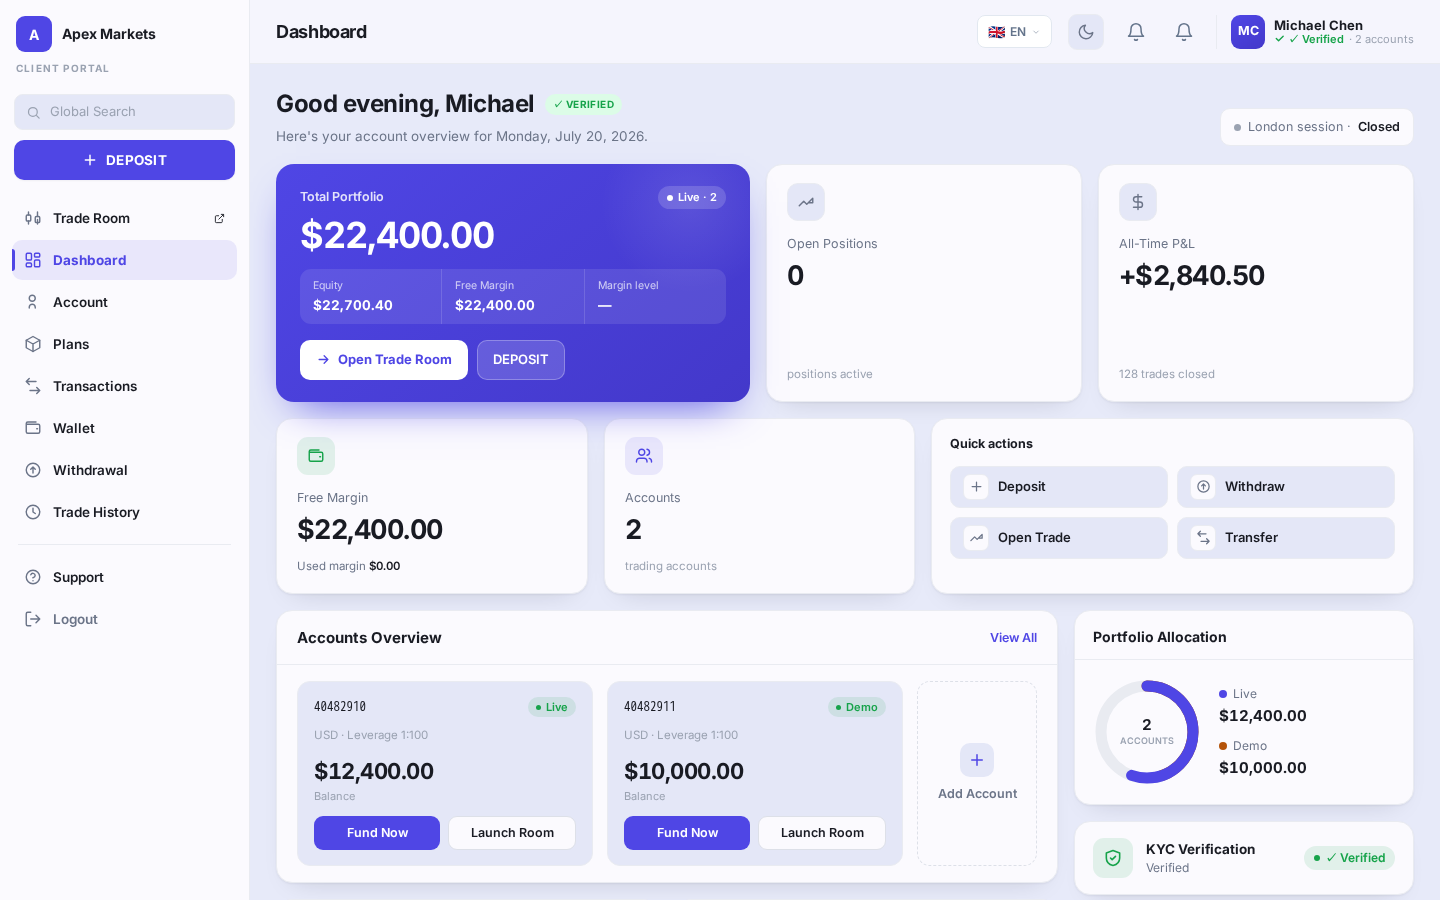
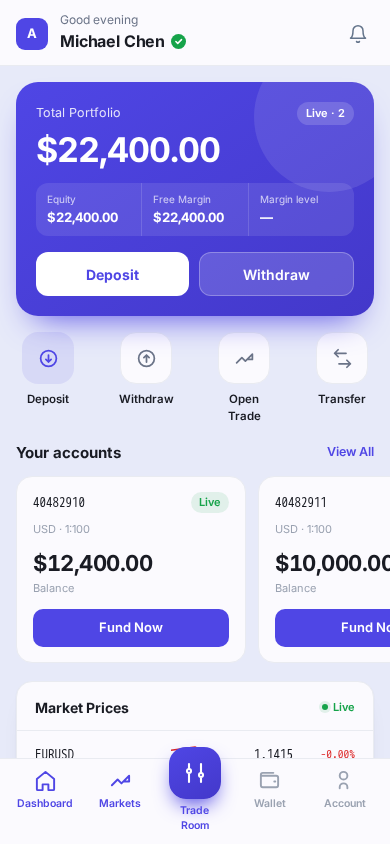
Real FirmForge client portal dashboard

Operator view and analyst view

Pre-built dashboards for the operator. Raw-data export for the analyst who wants to go deeper.

Operator dashboards

Monday-morning view: new deposits, retention by cohort, challenge pass rate, revenue by rail, payout rate, support volume. Everything the operator needs for a weekly stand-up, surfaced without opening five tools.

Analyst export

Full-fidelity data export to BigQuery or Snowflake with hourly refresh. Every entity (traders, orders, deposits, challenges, payouts, support tickets) as a stable schema. Your BI team runs their own queries without touching the platform.

Cohort Analysis

Who deposited, who stayed, who grew

Trader cohorts by signup month, acquisition source, country, and challenge size. Retention curves show the percentage still trading at 7, 30, 60, 90 days. Expansion curves show the percentage that upgraded account size or added accounts.

  • Signup cohort by month, source, country, challenge size
  • Retention curve at 7, 30, 60, 90 days
  • Expansion curve: who upgraded or added accounts
  • Comparable cohorts side-by-side

Signup month

40+

Source

50+

Retention

80+

Challenge size

20+

Expansion

15+

Country

10+

Revenue by Rail

The breakdown your acquirer never shows

Revenue, chargebacks, and net margin per rail (card, bank, crypto, e-wallet). Per-country and per-currency. Compare the actual settled revenue of a rail against the top-line deposit volume. The number your acquirer never surfaces because it is not in their interest.

  • Revenue, chargebacks, and net per rail
  • Per-country and per-currency breakdown
  • Net margin after processing fees and chargeback cost
  • Trend over time with alerts on margin degradation
Rail margin · EUR/USD
Card 0.50
Crypto
100,000
4.1% net
0.50
Bank
9,458
2.8% net after fees and chargebacks
1:100
Export
Alert

Challenge Economics

Pass rate, payout rate, revenue per challenge

The three numbers that determine prop firm economics: pass rate per account size and phase, payout rate on funded accounts, and revenue per challenge after payouts. Dashboarded by account size, phase, and marketing source.

  • Pass rate per account size and phase
  • Payout rate on funded accounts
  • Revenue per challenge after expected payouts
Challenge yield · XAU/USD
XAU/USD Account size
50k, 2-phase
2,318.10
Pass rate
2,341.00
9.4% over 180 days
2,305.50

Pass rate times payout rate times refund rate gives you the expected net revenue per challenge. Transparent for every account size on the platform.

LTV and Churn

Lifetime value by acquisition source

LTV calculated per trader using actual trading commission, platform fees, and payouts. Churn signals detected early: declining trade frequency, declining deposit size, support ticket spikes. The numbers that drive marketing spend decisions.

  • Trader-level LTV with running update daily
  • Churn signals from trading, deposit, and support activity
  • Acquisition payback period per source
Trader LTV · Standard 25k
Source6.2% / 8%
Paid search0.8% / 5%
Average 1,840 at 180 days2.1% / 10%

Data Export

BigQuery, Snowflake, raw CSV

Hourly export to BigQuery and Snowflake with a stable schema. CSV export for one-off analysis. Webhook delivery for state changes if your pipeline is event-driven. Keep your source of truth wherever your BI team already lives.

  • Hourly refresh to BigQuery and Snowflake
  • CSV export per entity and date range
  • Webhook delivery for every state change, ordered
Export schedule
BigQuery, dataset: brokerage_prod Destination
14:22:07 UTC
Last sync: 7 minutes ago

Common questions

Platform analytics, straight answers

The data layer, not a vanity metrics tool.

Operator dashboards update in real time for revenue and retention counters. Cohort analysis and LTV refresh every 10 minutes to amortize the compute cost. Export to BigQuery and Snowflake runs hourly. Nothing is more than an hour stale.

Every entity on the platform exports: traders, orders, deposits, withdrawals, challenges, payouts, support tickets, affiliate referrals, KYC events, product events. Full history, not just a materialized summary. Your BI team can rebuild any dashboard themselves.

Trader-level net revenue over a rolling window, calculated as commission plus spreads plus platform fees minus payouts minus refunds minus support cost. Updated daily per trader. The default window is 180 days with longer windows available for mature operators.

Trade frequency decline over 7 and 30 days, deposit frequency decline over 30 days, support ticket spike in the last 14 days, login frequency decline, trading on a weakening symbol only. Each signal is weighted and surfaces as a churn probability per trader.

Yes, inside your BigQuery or Snowflake destination with the exported dataset. The platform exposes the dataset schema and refresh schedule as part of the enterprise onboarding. Query cost in your BigQuery or Snowflake account is yours to monitor and optimize.

No. The platform exports clean, stable data into whatever your data team already uses. If you have a mature stack (dbt, Looker, Hex, Mode), the platform feeds that stack a trusted source table. If you do not, the operator dashboards are enough to run the firm.

The real numbers

Analytics that answer firm-growth questions

Cohorts, revenue by rail, retention, challenge economics, LTV, churn signals, raw export. The data layer every brokerage and prop firm needs, built in.

Numbers before gut, every Monday.